These email marketing statistics and sms marketing statistics come from the way we build most of what we publish: by looking at the patterns we've been seeing across our own customer base and the broader trends our team keeps an eye on in the inbox and text space.
Some of these numbers we've cross-checked against outside benchmarking where it mattered, but most of what's below reflects what we've simply learned from watching campaigns and lists behave, season after season.
A dynamic yardstick for your email and SMS performance
We update this list every year instead of writing it once and letting it sit, because the channel doesn't hold still. Inbox providers change their privacy defaults, automation platforms report new benchmarks, and consumer habits around texting shift enough that last year's numbers stop being useful reference points.
None of this is meant to replace your own reporting. Think of it as a set of guardrails, a way to check whether your open rates, click rates, and automation revenue split look like what we're seeing everywhere else, or whether something in your program deserves a closer look.
Navigating the email and SMS benchmarks
We've organized everything below into five sections, moving from how people actually read email today, through automation economics, broader performance benchmarks, the send-time and subject-line habits that don't need a citation, and finally SMS and omnichannel behavior. Read it straight through, or jump to the section that matches whatever you're trying to fix in your marketing campaigns this quarter.
We'll keep adding to this list as new benchmarks come out and as our own data shifts throughout the year, so treat this as a living reference rather than a one-time snapshot. If a number here doesn't match what you're seeing in your own program, that gap is often more informative than the stat itself.
Email Engagement Fundamentals
Before worrying about subject lines and send times, it helps to know where email actually gets read today. What we describe below comes from our own sending accounts, and it tracks closely with how Litmus tracks inbox behavior industry-wide. These first few email marketing statistics are the foundation everything else in this piece builds on.
Inbox market share vs. metric reliability
It's easy to design an email around whatever inbox happens to be open on your own screen, then wonder why performance doesn't match expectations everywhere else.
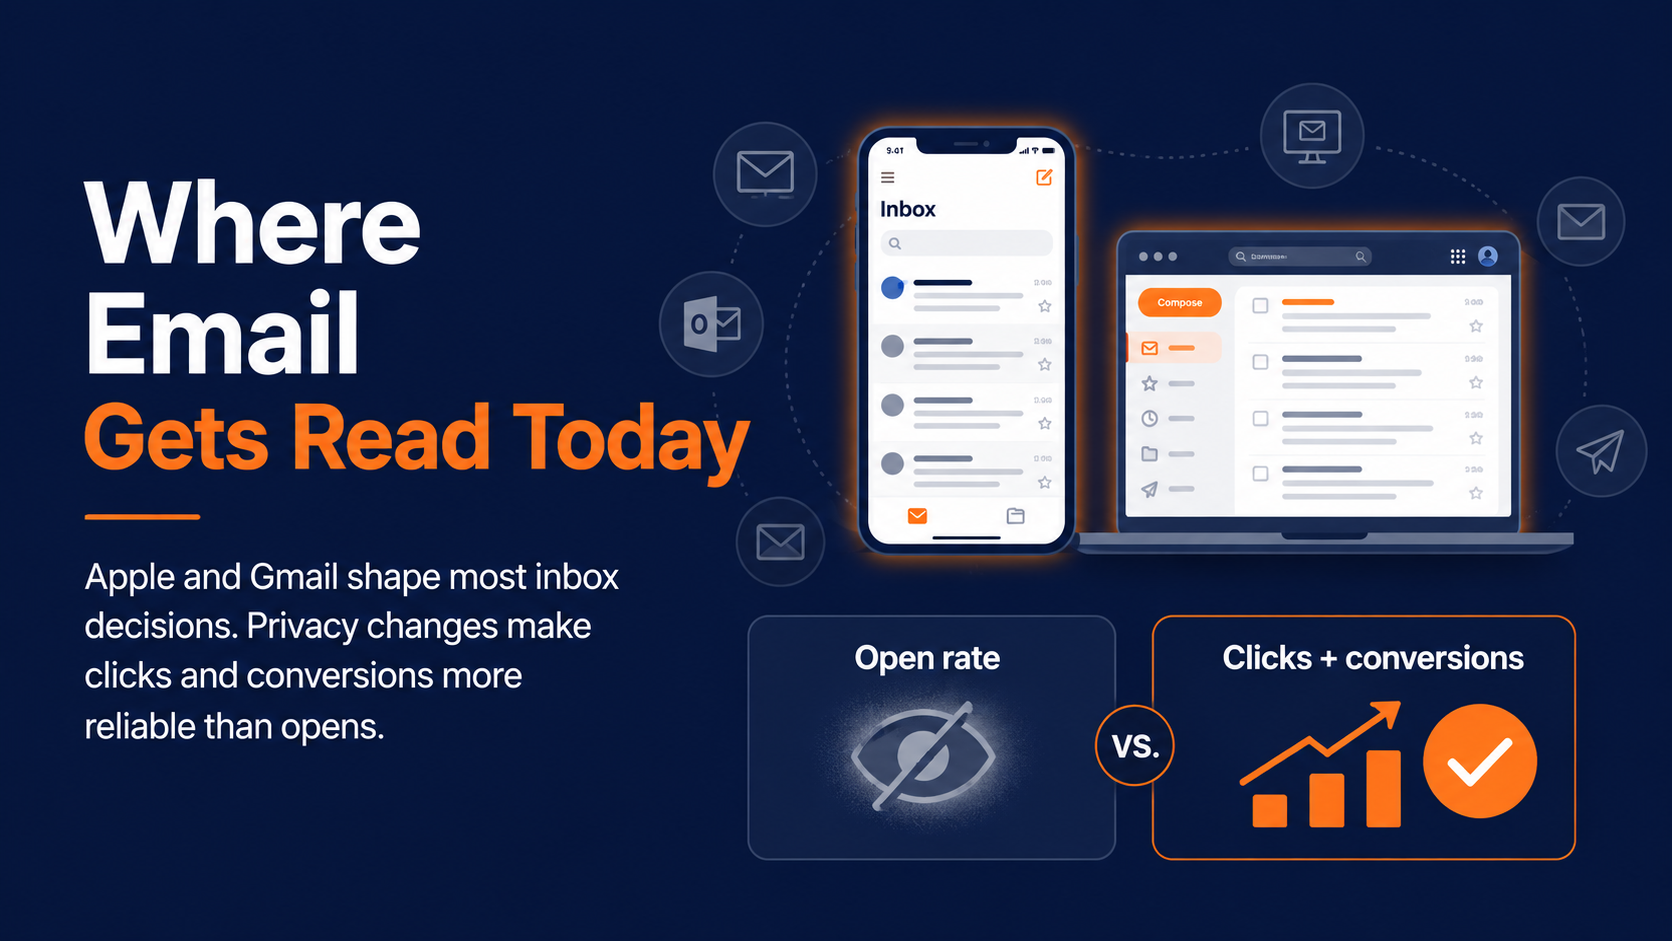
Apple and Gmail alone account for the overwhelming majority of where messages actually land, which means design decisions made for a niche client are design decisions made for almost nobody.
Email privacy changes have also made some of the metrics marketers have relied on for years less reliable than they used to be. Open rate used to be a reasonably clean signal.
Now it's muddied by automatic prefetching on a large share of devices, which is exactly why we lean more heavily on clicks and conversions in the sections that follow.
The variations inside Apple and Gmail
None of this means every subscriber behaves identically inside those two ecosystems. Apple's own user base splits meaningfully between iPhone Mail and other apps layered on top of it, and Gmail's web, app, and API-based access patterns each render slightly differently. But the broad strokes above are stable enough to plan around.
Inbox & device reality
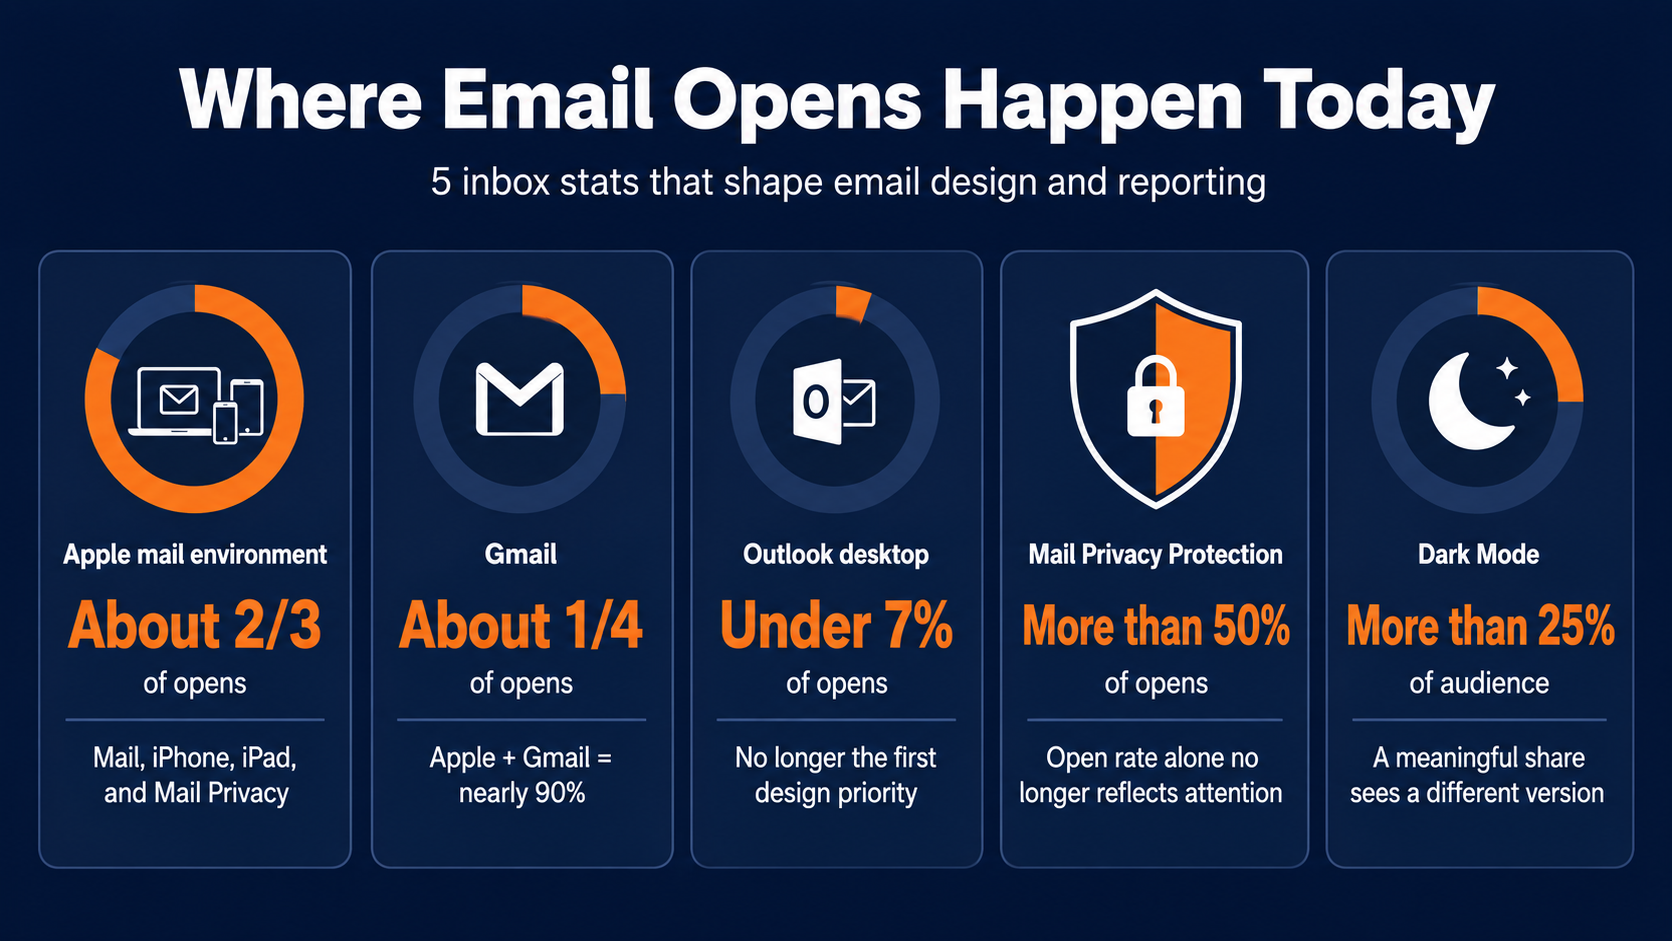
1. Apple's mail environment (Mail, iPhone, iPad, and Mail Privacy) now accounts for roughly two-thirds of the email opens we're seeing across our customer base.
2. Gmail sits at close to a quarter of opens. Between Apple and Gmail, that's nearly 90% of everywhere an email actually lands, before you even count anything else.
3. Outlook desktop has fallen to under 7% of opens across the accounts we looked at. It used to be the client every designer built around first. Not anymore.
4. Apple's Mail Privacy Protection now touches more than half of all opens we're tracking, which means open rate alone isn't measuring real attention for a big chunk of any list anymore.
5. Dark Mode is now in use by more than a quarter of the total email audience we're seeing. That's a meaningful share of a list viewing a version of an email that rarely gets previewed before it sends.
Personalization & Segmentation
6. Roughly 9 in 10 of the marketers we talk to say personalized or segmented experiences generate more leads and purchases for them.
7. Only about half of the programs we look at have gotten past basic personalization, meaning a name merge tag and nothing else. That's the floor, not the ceiling.
8. Barely 1 in 10 programs are doing real, behavior-based personalization. Almost everyone agrees it works. Almost nobody's built it.
9. Segmented campaigns are consistently driving somewhere around 30% more opens and 50% more clicks than unsegmented blasts in the data we work with.
Email Marketing Automation Statistics And Revenue Economics
Automated flows are the smallest slice of most sending programs and the largest share of their revenue, a gap wide enough that outside platform benchmarking shows the same pattern we've watched play out account after account. If you only pull one set of email marketing automation statistics out of this whole list, make it this section.
Why your lifecycle triggers deserve more focus
The reason this gap exists isn't complicated. A triggered message reaches someone at the exact moment they've shown interest, whether that's abandoning a cart, joining a list, or running low on something they buy regularly, while a campaign reaches everyone at the same moment regardless of where they are in that cycle.
Most of the email programs we look at under-invest here relative to the return, often because flows take more setup time upfront than a campaign calendar does. The data below is the argument for spending that setup time.
The cost of neglected lifecycle triggers
It's also worth separating flow performance from flow existence. Plenty of programs have a welcome series and an abandoned cart flow turned on, technically, but haven't touched the copy, timing, or offer inside them in over a year. The stats above describe what well-maintained automation looks like, not just automation that exists.
Flow performance
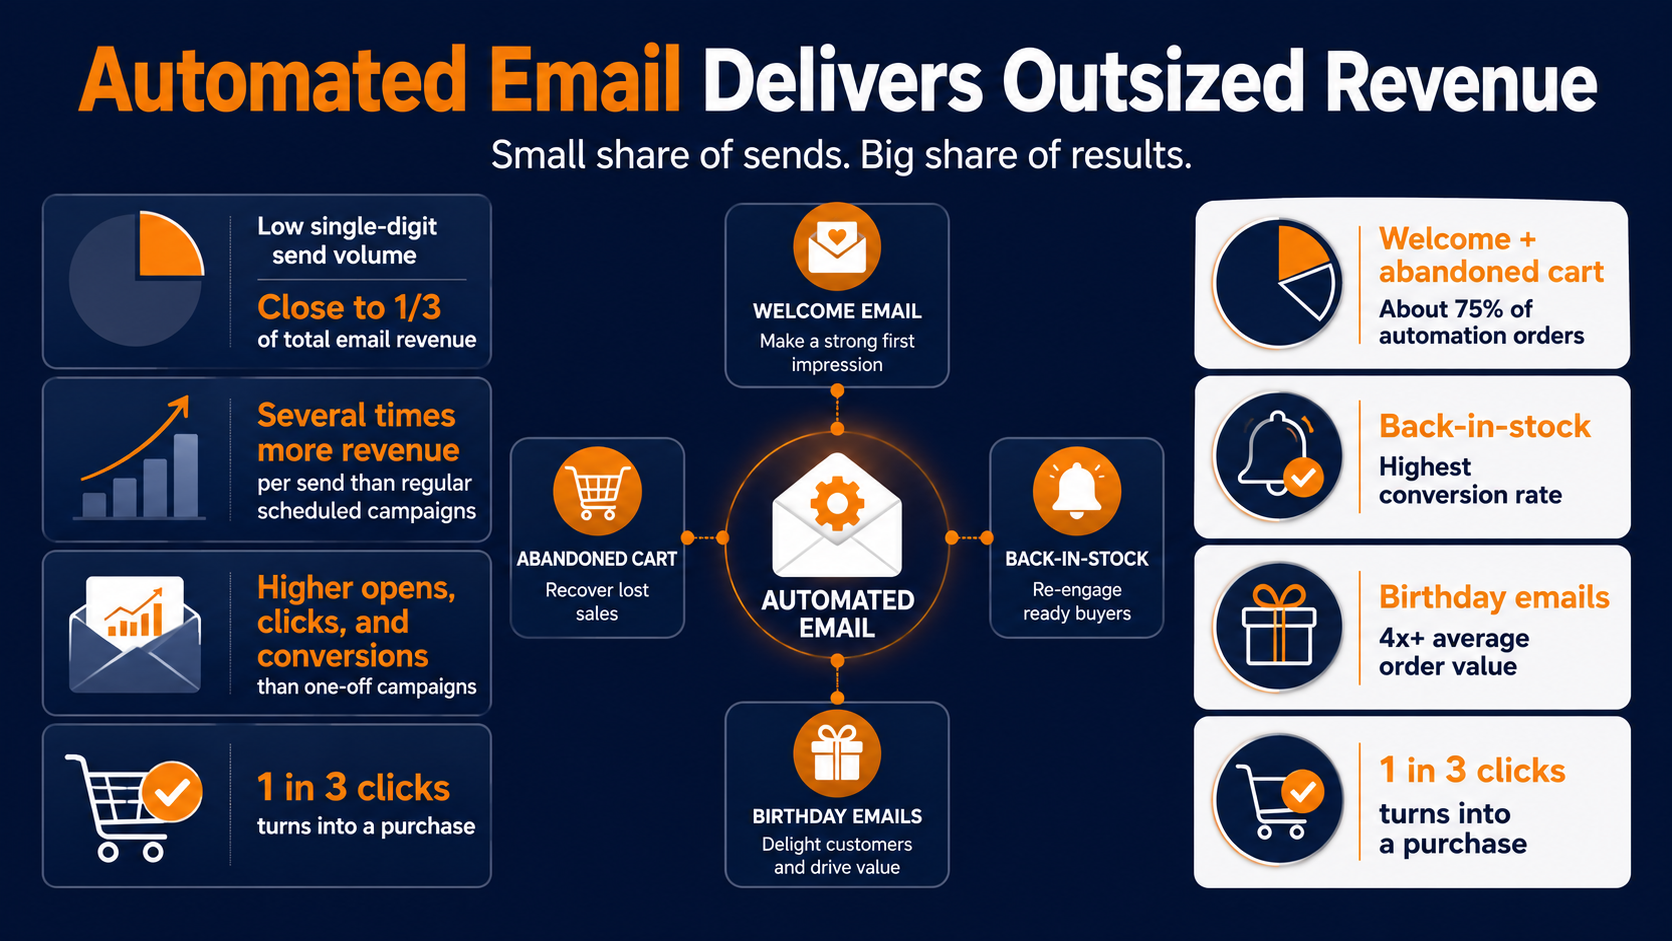
11. Each automated email tends to earn several times more per send than a regular scheduled campaign, the single biggest gap we see in any email performance comparison.
12. Automated messages consistently show meaningfully higher open rates, several times stronger click engagement, and dramatically higher conversion rates than one-off campaigns.
13. Abandoned cart and welcome messages together are still driving the majority of automation-generated orders, somewhere around three-quarters combined.
Where Automated Revenue Concentrates
14. Back-in-stock emails have the highest conversion rate of any automation type we track, landing well above every other flow type.
15. Birthday emails routinely produce an average order value four times or more above a typical order. Nobody expects the birthday send to be the highest-AOV email in the flow. And yet.
16. Roughly 1 in 3 clicks on an automated email results in an actual purchase, a much stronger buying signal than a typical newsletter click ever gives you.
Email Marketing Benchmarks And Overall ROI
Zoom out from individual flows, and email is still doing what it's always done: quietly outperforming flashier channels while getting less credit for it.
That holds up against broader industry benchmarking as well as it does in our own customer data. Use these email marketing benchmarks as a gut check against your own program, not as a target to hit blindly.
Closing the gap with segmentation and marketing automation
It also helps explain why email keeps its budget even in years when other line items get cut. It's measurable in a way some channels aren't, the attribution is cleaner, and the cost to reach an existing list is a fraction of paid acquisition.
That doesn't mean every email program is performing well just because the channel overall is healthy. The gap between a program hitting these benchmarks and one falling well short of them is almost always a segmentation and automation gap, not a channel problem.
How to investigate your email marketing benchmark gaps
These email marketing benchmarks also shift a little by industry and list size, so treat them as a directional range rather than a pass or fail line.
A program well outside this range in either direction is worth investigating, whether that means finding out what's working so well it can be repeated, or catching a problem before it compounds.
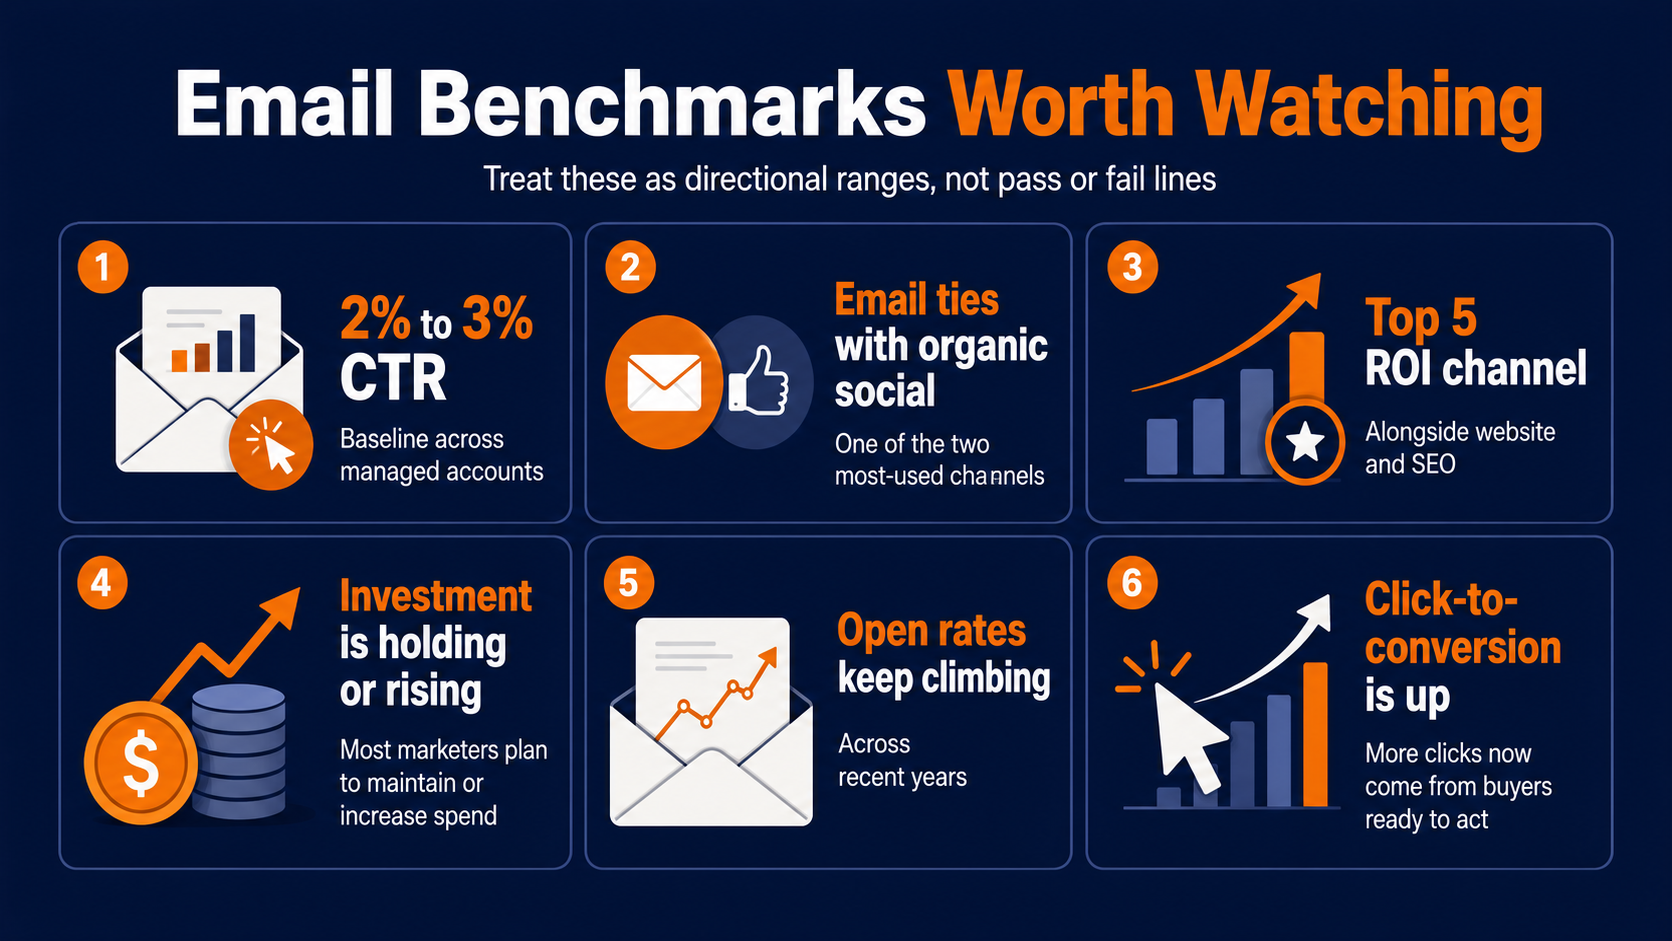
17. Average click-through rate across the accounts we manage is holding around 2 to 3%. That's the baseline; anything meaningfully below it is a signal, not noise.
18. Email now ties with organic social as one of the two most-used marketing channels among the businesses we work with.
19. Email regularly ranks among the top five ROI-driving channels for our customers, right behind their website and SEO efforts.
20. The large majority of marketers we talk to plan to maintain or increase their email investment this year. Budgets are tight everywhere else. Email keeps getting funded.
21. Email open rates have climbed for several years running across our customer base, even as click rates have leveled off. People aren't tuning email out. If anything, the opposite.
22. Click-to-conversion has jumped significantly year over year across our data. Fewer people are clicking out of curiosity. The ones who do click are ready to buy.
Timing, Subject Lines & Send Practices
Some of what moves the needle here doesn't need a citation. This is what nearly two decades of watching campaigns and lists behave has taught us, and it's held up just as well this year as it did years ago.
We separate this section out because none of it requires a benchmark report to validate. These are habits we've watched play out across enough sends, over enough years, that they've become closer to operating principles than open questions.
Why predictable timing beats unpredictable tactics
If you only make one change after reading this list, make it here. Timing and subject line habits are usually the fastest thing to fix, and the first thing that shows up in next month's numbers.
We also hear a version of the same objection every time we share this section: won't subscribers get tired of predictable timing? In practice, the opposite tends to happen. Predictability builds trust, and trust is what gets an email opened instead of archived unread.
Subject lines & deliverability habits
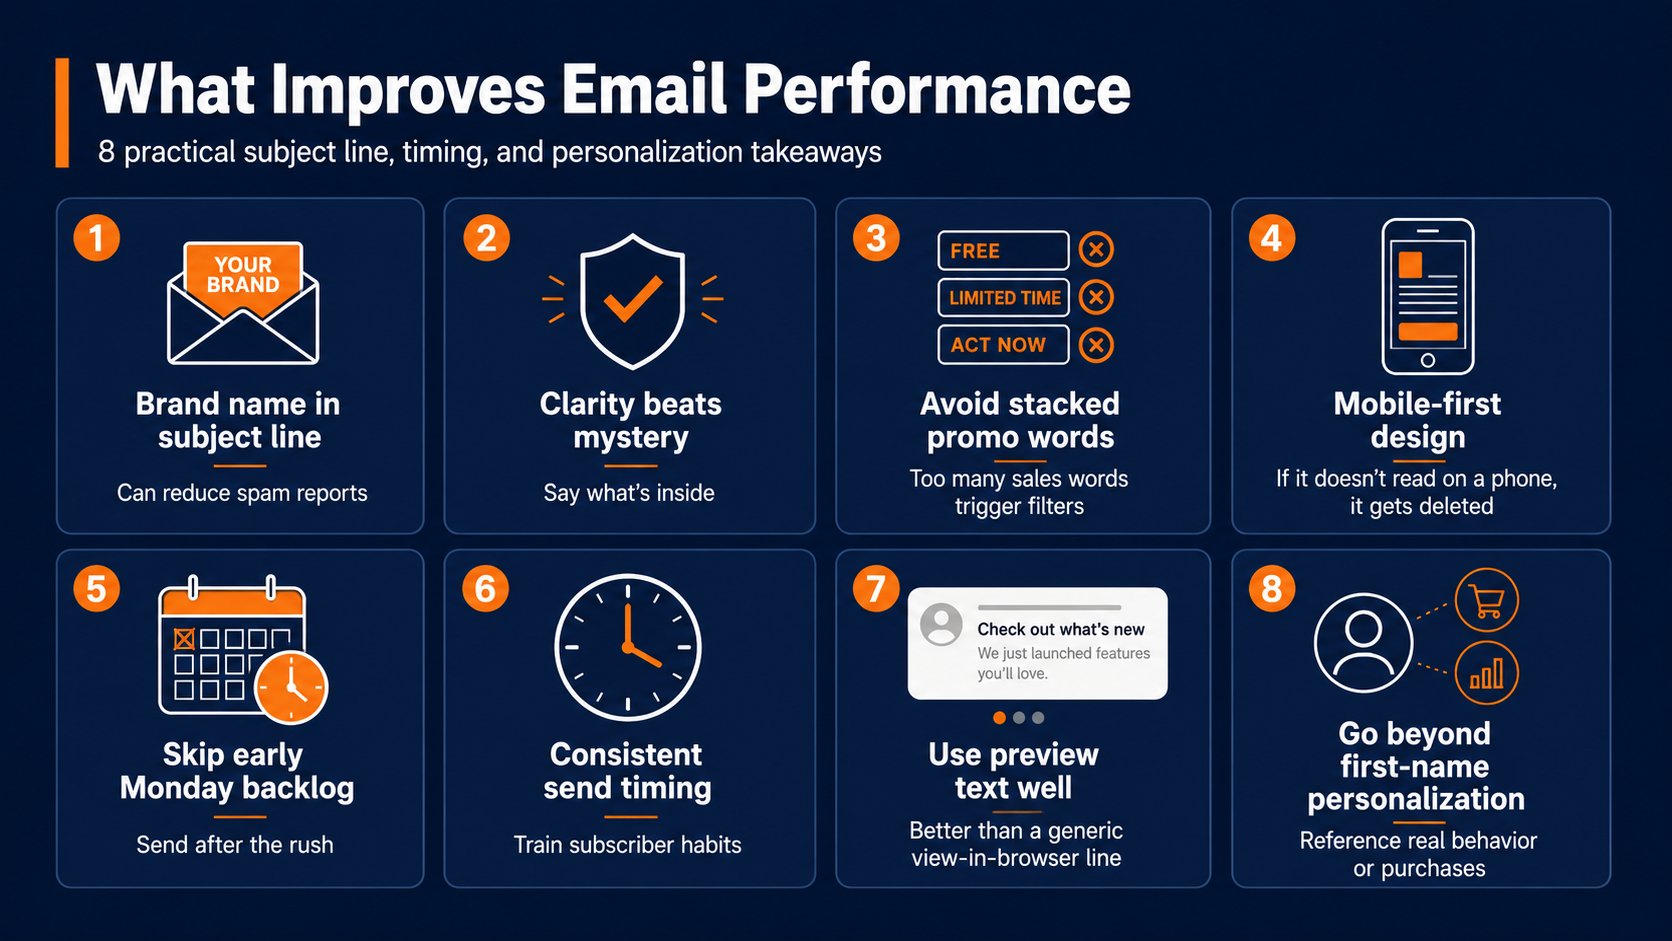
23. Keeping the company name somewhere in the subject line still meaningfully cuts down on spam reports, whether the content inside is spammy or not.
24. Subject lines that say specifically what's inside consistently beat vague, curiosity-driven ones. Mystery doesn't out-perform clarity.
25. Stacking words like “clearance,” “percent off,” and “claim” in one subject line still trips spam filters. One of them is fine. Three starts to look like every other blast in the folder.
26. Emails that don't render cleanly on a phone screen get deleted, not zoomed into. Mobile-first design isn't optional anymore.
Timing & Frequency
27. Sending first thing Monday morning puts a message at the back of a weekend's worth of backlog. A send that lands once the early rush clears tends to perform better.
28. Consistency in send day and time trains a habit in the subscriber's inbox. Randomizing when a brand shows up works against it more than for it.
29. A short preview line that previews the best sentence in the email still beats a generic “view in browser” default. That's free real estate most senders waste.
30. Personalizing beyond a first-name merge tag, referencing an actual purchase or something the person actually browsed, outperforms the name tag alone.
SMS Marketing Statistics And Omnichannel Marketing Performance
SMS stopped being the experimental add-on channel a while back. What we see in our own accounts lines up with outside consumer research on how people actually want to be texted.
These sms marketing statistics matter just as much as the email numbers above, especially for anyone still treating text as an afterthought channel.
How consumer standards for SMS have shifted
Part of what's changed is simply exposure. A few years ago, receiving a text from a business was unusual enough that it stood out, for better or worse. Now most people have opted in to texts from several businesses at once, which raises the bar for what actually earns a read instead of a swipe to delete.
That shift also means SMS can't be treated as a smaller, cheaper version of email and run the same way. The channel rewards brevity, timing, and restraint in ways email is more forgiving of, and the numbers below reflect what happens when brands respect that difference and when they don't.
Earn your place in the text inbox
None of this is an argument for texting more. If anything, it's the opposite. The businesses seeing the best results tend to send less often than they think they can get away with, and treat every text as something that earned its place in a much shorter, much more personal channel than email.
Consumer SMS behavior
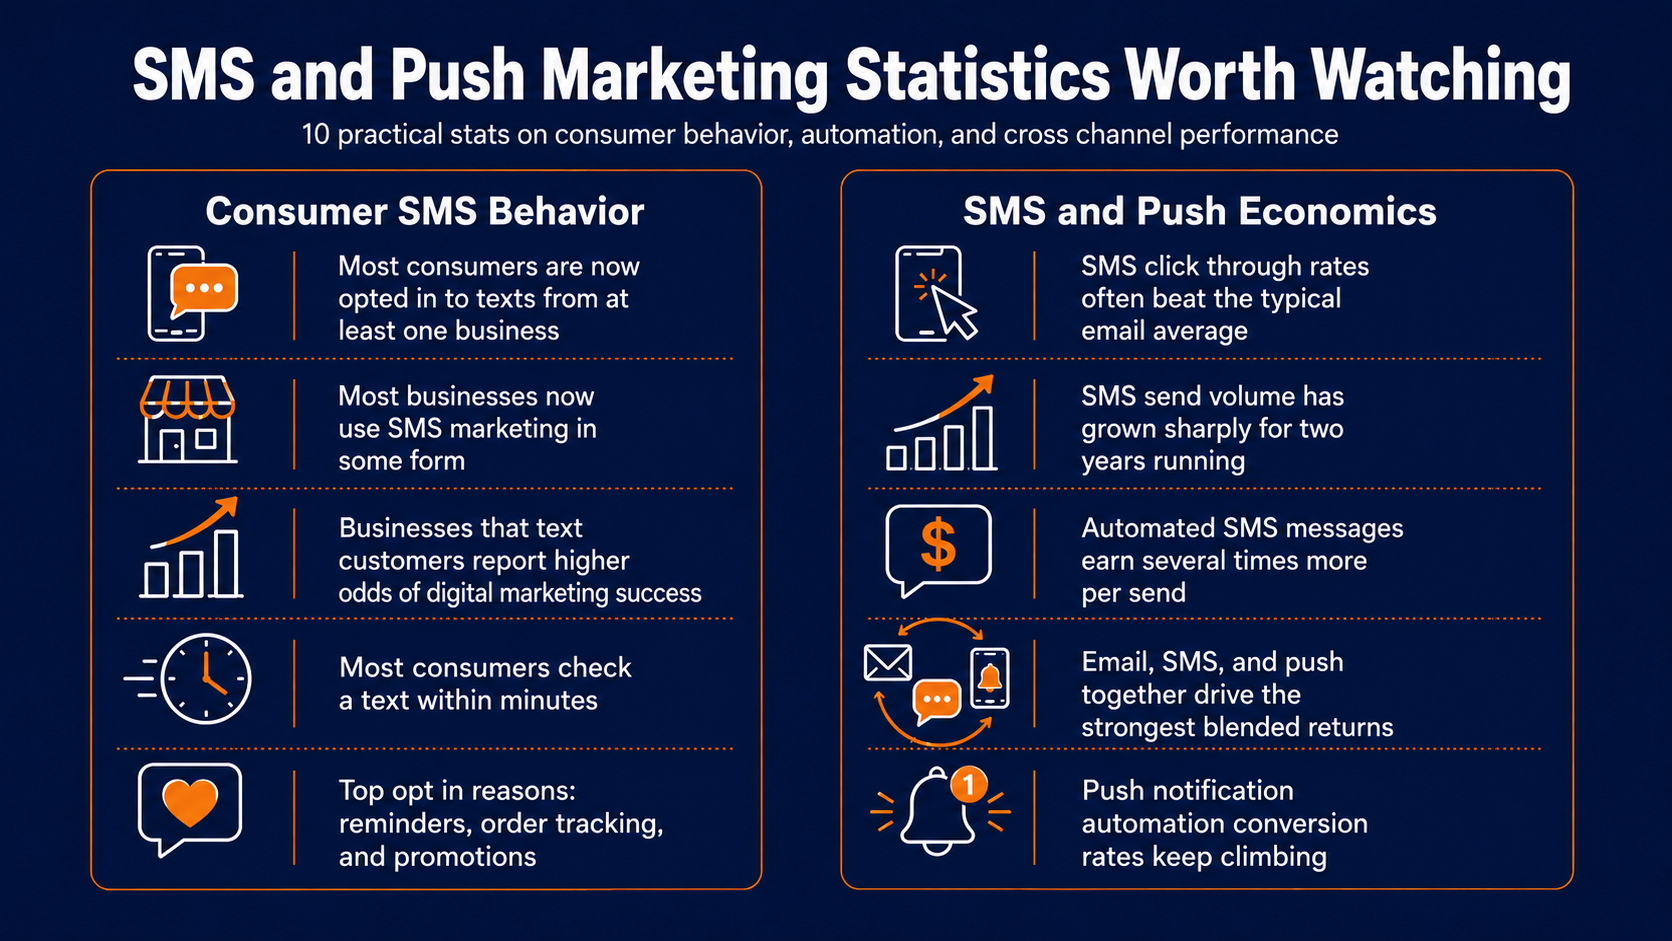
31. The large majority of consumers we survey are now opted in to texts from at least one business, a sharp climb from just a few years ago.
32. Most of the businesses we talk to now use SMS marketing in some form, a big jump from where adoption sat a year ago.
33. Businesses that text their customers report meaningfully higher odds of overall digital marketing success than those that don't.
34. Most consumers check a text notification within just a few minutes of receiving it. There's no other channel where that's true.
35. The top reasons people opt in are appointment reminders, shipment and order tracking, and promotions, in that order. Utility comes before deals.
SMS & push economics
36. A majority of businesses report SMS click-through rates well above the typical email average.
37. SMS send volume has grown sharply for two years running across our customer base. That's compounding, not a one-time spike.
38. Automated SMS messages earn several times more per send than standard SMS campaigns, echoing the same pattern we see in email.
40. Push notification automation conversion rates have climbed meaningfully year over year, giving brands a low-friction channel for last-mile nudges once a customer's already close to acting.
What These Email Marketing Statistics and SMS Marketing Statistics Are Actually Telling You to Do
None of this is trivia. If there's one sentence that carries this whole list, it's this: the gap between your numbers and these benchmarks is more useful information than the benchmarks themselves.
That's the part people skip past. They read that automated flows drive a third of revenue off a sliver of send volume, nod, and go back to building next month's campaign calendar anyway. We've watched that happen with our own list more than once.
Why targeted messages beat batch-and-blast
Here's the part that's easy to miss. Every stat in this piece points the same direction: the channel rewards attention over volume. Segmented over blasted. Triggered over scheduled. Text that earned its place over text that showed up because it was Tuesday.
Ready to fix the gaps in your program?
So the real question isn't whether your open rate looks fine next to the industry average. It's whether your welcome flow has been touched since you built it, or whether your SMS program is still treating every send like a coupon.
If you're not sure, that's worth twenty minutes with someone who looks at this across a lot of accounts, not just yours. Request a demo, and we'll walk through where your program actually sits against these numbers, and what's realistic to fix first.